STAND Newsletter Dec 23
Melissa tells us about the tree canopy cover data she’s produced
Identifying trees & scrub inside and outside of woodland
In the Summer the STAND team led two stakeholder workshops, one in the North Pennines (England) and one in the Elan Valley (mid-Wales). From these workshops, each stakeholder group came up with their ‘Land Use Vision’ for 2050, detailing the interventions (e.g. peatland restoration, wood pasture, woodland creation etc) they would like to see in the landscape, and the rules for where and where not these interventions could be implemented.
Since these workshops, work is under way to convert these Land Use Visions into spatially-explicit future land use scenarios and then use the outputs of these to predict the impacts on a number of ecosystem services including carbon sequestration and food & timber production, as well as bird populations. To predict the impacts of future land use, we also need to understand the current day landscape, which includes the habitat type and trees. Most spatial data for trees includes woodland blocks, some trees outside of woodlands, but not single trees or scrub. Therefore, this is something we needed to understand to help with our current and future predictions across the landscape.
To do this we used Light Detection and Ranging (LiDAR) data including a Digital Elevation Model (DEM) which is the height of the bare earth, and a Digital Surface Model (DSM) which is the height including objects such as buildings and vegetation. In order to identify trees and scrub across our two landscapes, we calculated the difference between the DEM and DSM to create a Canopy Height Model (CHM) which is the height of all objects above the Earth’s surface. Using the Canopy Height Model we could calculate tree crowns and height for all vegetation, using an R package called ‘ForestTools’. From these, we removed buildings and used a threshold to define scrub, which was calculated using the mean height of vegetation which is mapped as scrub in an independent dataset.
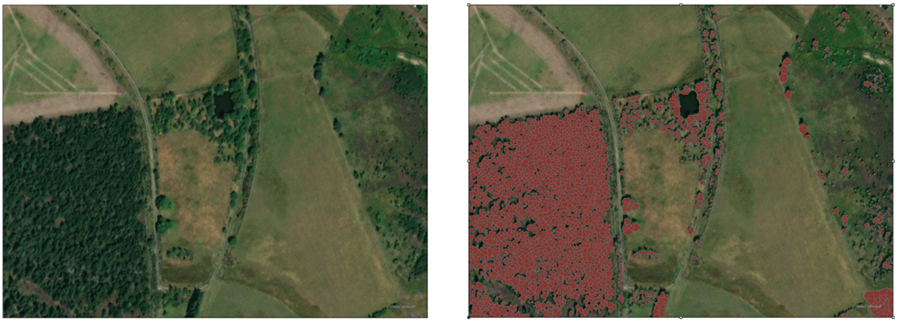 Satellite imagery (left), overlain with tree crown polygons (right)
And there we have it – data which maps the canopy and height of trees and scrub across both our landscapes which we will use to prediction the carbon sequestration and bird populations, both in the current landscape and under future scenarios.
Melissa Minter